|
|
Connecticut's population in the first census in 1790 was 237,946. In the 2020 census Connecticut's population is 3,605,944. Our population was 6th largest out of 13 states in the first census, and now is ranked 48th. (U.S. Census)
|
|
|
|
Data News
Latest System Updates
In June the U.S. Bureau released new updates to improve the user experiences. The release is a modern design features across data.census.gov. The platform now features a new landing page and redesigned geographic
profiles.
|
|
|
What can we learn about racial disparities in CT from ACS 2020?
Even as people across the state at all levels engage in efforts to ensure all of Connecticut’s residents have a chance to thrive, marked disparities still exist in educational attainment, employment, and earnings across racial and ethnic groups in Connecticut. To inform efforts to promote equity, we examined these disparities across the state
and within Connecticut’s five largest cities using the ACS 2016-2020 5-year estimates.
|
|
|
|
Spring Data Walk with Hartford Youth Researchers
On June 8th, the Hartford Data Collaborative (HDC) hosted its first Data Walk focused on data about youth engagement in Hartford. Earlier this spring, the Hartford Data Collaborative launched its inaugural cohort of Hartford Youth Researchers. The Data Walk marked the first direct community involvement in an HDC project.
|
|
|
Data for the Community with the Equity in Data Community of Practice
This article, about a group of Trinity College students that
took an 87-page legal document and turned it into easy-to-read graphics that the people most affected by this agreement might be able to understand and interact with, caught the attention of many. These students conducted analysis and compiled charts to explain the progress of the Sheff v. O’Neill agreement. They also interviewed those they hoped would use the charts to ensure the information was clear to them.
|
|
|
The Journey of Advancing Equitable Data Practice in our Connecticut Organizations
In May, over 40 data users joined together to learn from real-life examples of equitable data practice. We heard from four group members who have attended many of the sessions we have run in the last two years. While the discussion was rich and difficult to summarize in a blog post, here are some of the
highlights.
|
|
|
|
In person events are back!
If you're interested in connecting with other data users again, our in-person workshops are a great place to do that! Check out the opportunities below, and see more here.
|
|
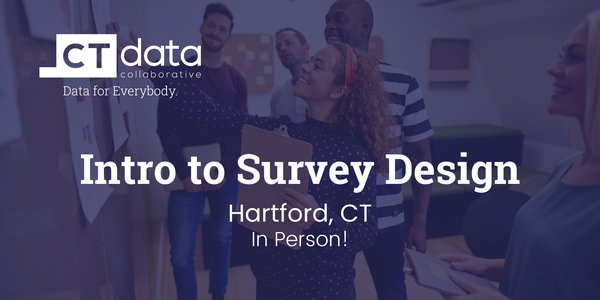
| Intro to
Survey Design (In-Person)
Thursday, July 21st | 10:00am - 12:00pm
Survey data can help you gather important information about your programs, clients, and services. However, there is a science to crafting and designing surveys that gather meaningful insights to improve your work. This class will provide general guidelines and practices in survey design, including for customer surveys and evaluative surveys,
and will provide you with the knowledge and skills to help you create better surveys.
In Intro to Survey Design you will learn how to:
-
Develop questions that give you meaningful information.
-
Identify survey questions using best practices.
-
Create a high-quality survey.
After attending this workshop you will have the skills you need to put into practice to improve the quality of your survey data.
|
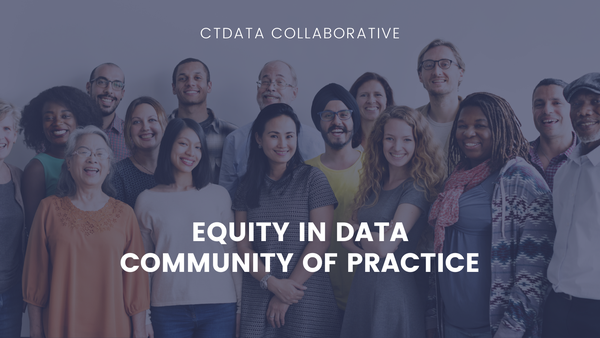
| Equity in Data: Community of Practice
Tuesday, August 16th | 11:30am -1:00pm
We are a group of data users in Connecticut who are supporting one another as we work toward more equitable data practices. We focus on racial equity explicitly but not exclusively.
Topic is to be determined. Learn more about this group here.
|
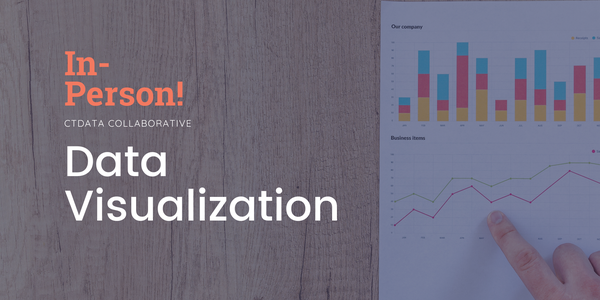
| Data Visualization (In-person)
Friday, September 23rd | 9:00am - 12:00pm
During this hands-on workshop, you will learn the principles of data visualization and apply them with free tools. By learning the principles of data visualization you be able to create simple, compelling charts that effectively convey insights you gain from data, no matter what tool you use.
In Data Visualization you will learn how to:
- Make decisions about color and design to communicate your message.
- Create graphs in Datawrapper and Tableau.
- Make decisions about how much detail to show (or not) depending on your audience.
|
| Welcome Jackie!
As the Data Engagement Specialist, Jackie Vancour (she/they) supports residents of Connecticut by instructing public and custom workshops designed to increase participants’ data literacy. With her Master's in Community Psychology and focus in program evaluation from the University of New Haven, she honed her passion for teaching. Jackie is excited
to join the CTData team, contribute to data equity, and work with organizations doing good across Connecticut. In her free time, you will find Jackie pursuing creative interests, such as pyrography, practicing meditation and yoga, and going on hikes in search of mushrooms. We're excited to
have Jackie on the team!
|
Encore!Connecticut
Encore!Connecticut, a nationally-recognized program that assists corporate and public sector professionals transition to opportunities in the nonprofit sector, is accepting applications for the Fall 2022 class. For the ninth straight year, AARP Connecticut is offering scholarships for accepted members of the four-month program. Encore!Connecticut – held
on Saturdays, with optional, extra-learning, Friday sessions – will run from September 10 to December 10 this Fall. Visit the Encore!Connecticut website for details and to apply. The deadline is September 2.
|
Copyright © 2022 CTData Collaborative, All rights reserved.
|
|
|
|