|
|
It's Caribbean American Heritage Month! The population that identifies as having West Indian ancestry increased 15% in Connecticut between the 2010 and the 2020 ACS 5-year estimates. The number people who identified as West Indian* in
Connecticut grew from 79,571 in 2010 to 91,432 in 2020 (ACS 5-year estimates, Table B04006). The largest population remains the Jamaican population, which in 2020 made up 63% of the West Indian
population, and which also grew the most numerically (by 8,218 people). Access more Census Bureau data here.
|
|
|
|
Quasi Public Data Update
CTData has updated the Quasi-Public data platform with 2021 data that contains payroll and checkbook information. Quasi-public agencies are independent government corporations that are created through legislation to perform a particular service or set of public functions. The portal now has three years’ worth of data. Explore the portal here.
|
|
|
Census Releases 2020 Post-Enumeration Survey Results: How Is Connecticut Impacted?
On May 19th, the Census Bureau released 2020 undercount and overcount rates by state from the Post-Enumeration Survey (PES). Thankfully, the results found that Connecticut had only a small undercount (0.13%), below the national average of 0.24%. Read more on our blog.
|
|
|
|
Connecticut Marks Asian/Pacific American Heritage Month
May was Asian/Pacific American Heritage Month – a celebration of Asians and Pacific Islanders in the United States. Is your town among those with the largest increase, or perhaps among those whose AAPI population more than doubled? Read the blog post to find out and to learn more about this population in Connecticut.
|
|
|
|
In person events are back!
If your'e interested in connecting with other data users again, our in-person workshops are a great place to do that! Check out the opportunities below, and see more here.
|
|
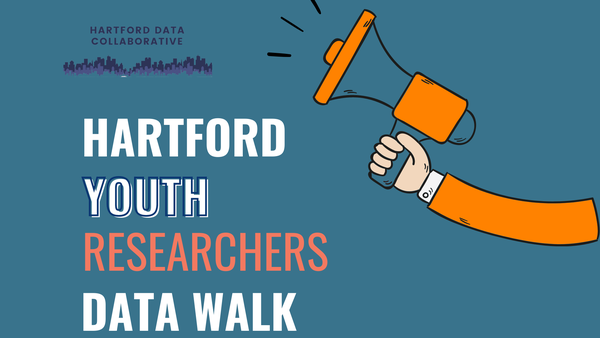
| Hartford Youth Researchers
Data Walk
Wednesday, June 8th | 4:00pm - 5:30pm
Please join the Hartford Data Collaborative and the Hartford Youth Researchers for a presentation on findings on Hartford youth engagement. HDC and Youth Researchers will discuss their analysis of data integrated from city providers of youth engagement programs and indicators for Hartford Youth.To RSVP email Kate Eikel at [email protected]
|
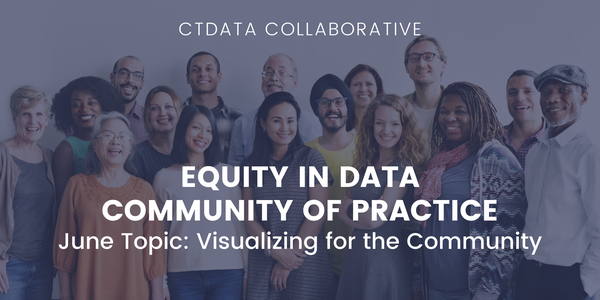
| Equity in Data: Community of Practice
Tuesday, June 21st | 11:30am - 1:00pm
If this article about the work of a group of Trinity College students, who conducted analysis and compiled some charts to explain the progress of the Sheff v. O’Neill agreement caught your eye, you’re not alone.
For our June session, we have invited Jack
Dougherty, the Trinity professor who supported this intriguing data work, to talk with us about the process of turning an 87-page legal document into some easy-to-read graphics that the people most affected by this agreement might be able to understand and interact with. Between first-hand experience by students and buried data about the progress of desegregation, the students compiled
information that can help residents of the Hartford region advocate for equal access to education as envisioned in this movement.
|
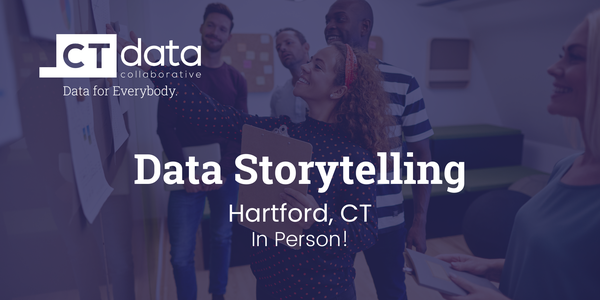
| Data
Storytelling (In-Person)
Thursday, June 28th | 10:00am - 12:00pm
We have all seen or created charts depicting data that have resulted in confusion, or worse, have unintentionally mislead readers. If you need to communicate data to any audience, this workshop will give you foundational knowledge and skills to become a Data Storyteller.
In Data Storytelling you will learn:
-
What a “data story” is and how it differs from data reporting.
-
A process to create clear and compelling data stories.
-
How to combine your insights and findings with a visualization to help readers remember the story - and guide them to action.
Becoming a Data Storyteller is a practice. By applying what you learn in this workshop, you can learn to create data stories that will not only help readers remember what they’ve seen, but will help you guide your audience to action.
|
| Intro to Survey Design (In-Person)
Thursday, July 21st | 10:00am - 12:00pm
Survey data can help you gather important information about your programs, clients, and services. However, there is a science to crafting and designing surveys that gather meaningful insights to improve your work. This class will provide general guidelines and practices in survey design, including for customer surveys and evaluative surveys,
and will provide you with the knowledge and skills to help you create better surveys.
In Intro to Survey Design you will learn how to:
-
Develop questions that give you meaningful information.
-
Identify survey questions using best practices.
-
Create a high-quality survey.
After attending this workshop you will have the skills you need to put into practice to improve the quality of your survey data.
|
CTData News
We're hiring an Operations Manager!
We’re hiring an Operations Manager. The purpose of this role is to support the daily operations of CTData, and includes managing Salesforce, grant reporting, assisting with administrative duties, and more. To learn more about the role and to apply, click here.
We Launched a New Social Enterprise: CTData Strategic Planning!
Through our work with data professionals across the state, we have found that either nonprofits are awash in data they don’t know how to use, or nonprofits aren’t sure what to collect and how to use it strategically. If this sounds familiar, learn more about this service here. More information will be coming soon.
|
Copyright © 2022 CTData Collaborative, All rights reserved.
|
|
|
|